Analyzing U.S. Treasury Holders: Q4 Trends and Investment Insights

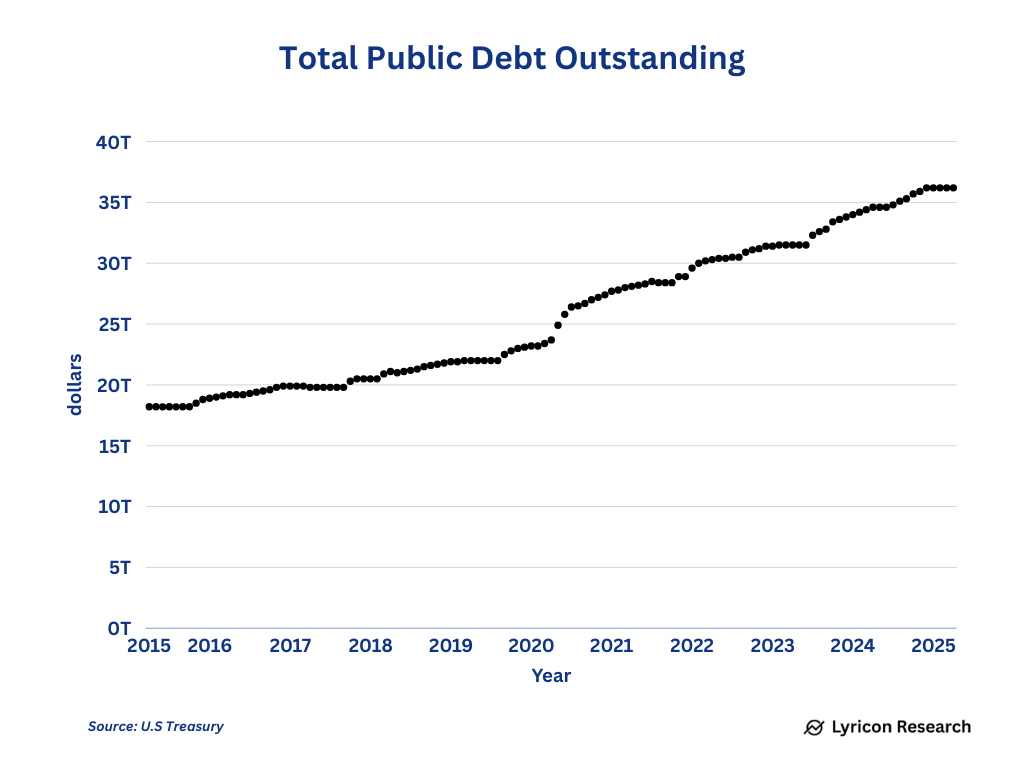
In January, the U.S. national debt surged to its statutory ceiling of $36.2 trillion, a threshold set by Congress. Since 1917, managing the debt ceiling has become a recurring challenge in American governance. To avoid default, Congress has raised, extended, or revised the debt limit over 100 times. Each time the Treasury nears a cash shortfall, Congress ultimately reaches an agreement to raise the cap, allowing the government to borrow large sums to replenish its checking account — often resulting in a sharp, short-term increase in debt of hundreds of billions of dollars.
These U.S. Treasuries are held as interest-bearing assets by both domestic and international public and private entities. Amid ongoing divestment by some holders, the critical question remains: Who still holds U.S. government debt — and who is selling?
Breakdown of U.S. Treasury Holders
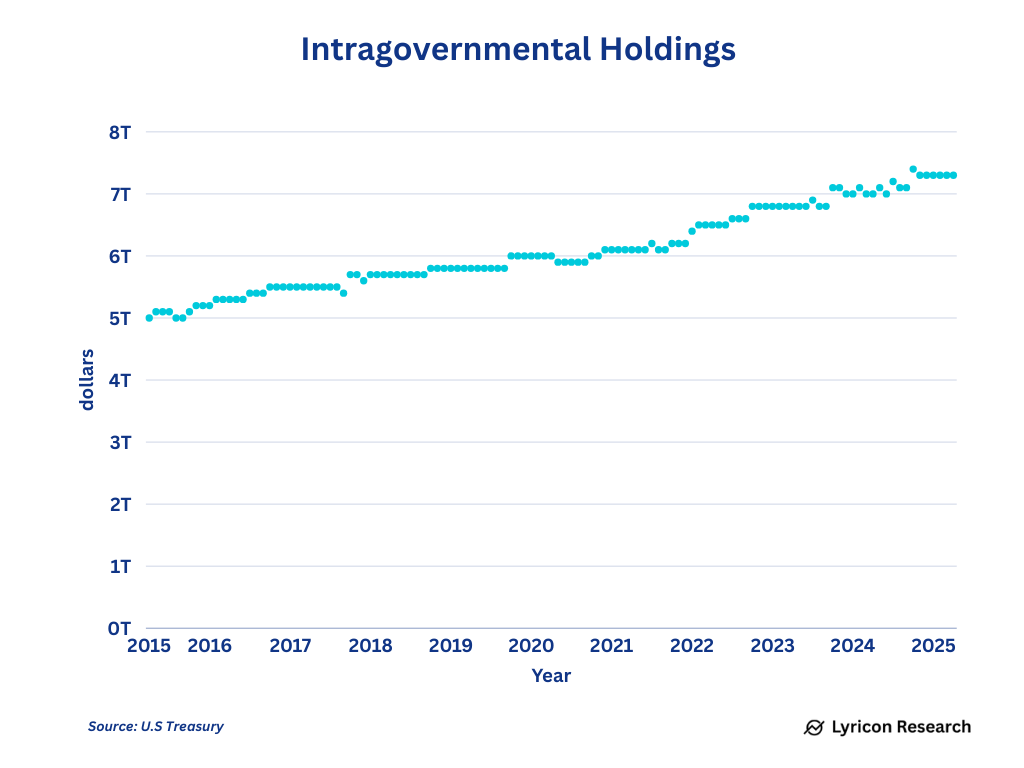
I. Intragovernmental Holdings – $7.29 Trillion
These are non-marketable securities held by U.S. government trust funds, including:
- Federal Civil Service Retirement and Disability Fund
- Military Retirement Fund
- Social Security Trust Fund
- Disability Insurance Trust Fund
- Medicare Trust Funds
- Other government funds
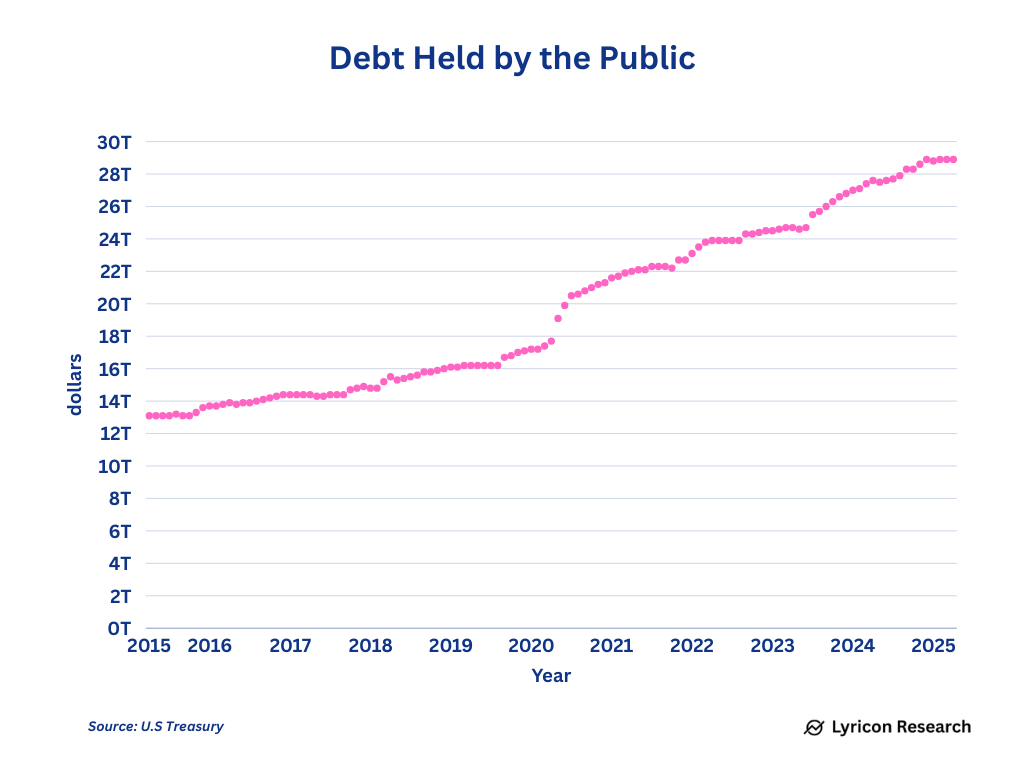
II. Publicly Held Debt – $28.92 Trillion
This includes marketable securities held by investors globally:
- Treasury Bills (≤1 year): $6.39 trillion
- Treasury Notes (2–10 years): $14.6 trillion
- Treasury Bonds (20–30 years): $4.8 trillion
- TIPS (Inflation-Protected Securities): $2.0 trillion
- Floating Rate Notes (FRNs): $0.63 trillion
- Non-marketable savings bonds (e.g., Series I Bonds): $0.575 trillion
Foreign Holders – $8.5 Trillion (30.2% of Public Debt)
Foreign investors, including both the private sector and official institutions such as central banks, held $8.5 trillion of U.S. Treasuries:
- Foreign private sector: $4.73 trillion
- Foreign official institutions: $3.78 trillion
By Maturity:
- Long-term securities: $7.31 trillion
- Short-term Treasury bills: $1.2 trillion (14.1%)
Q4 Developments:
Foreign holders reduced their U.S. Treasury positions by $166 billion in Q4, a 1.9% decline from the Q3 peak of $8.69 trillion. Key sellers included:
- Six Financial Hubs (UK, Belgium, Luxembourg, Switzerland, Cayman Islands, Ireland): -$60 billion
- Japan: -$36 billion
- Brazil: -$33 billion
- India: -$28 billion
- Eurozone (excluding Luxembourg, Belgium, Ireland): -$12 billion
Exception:
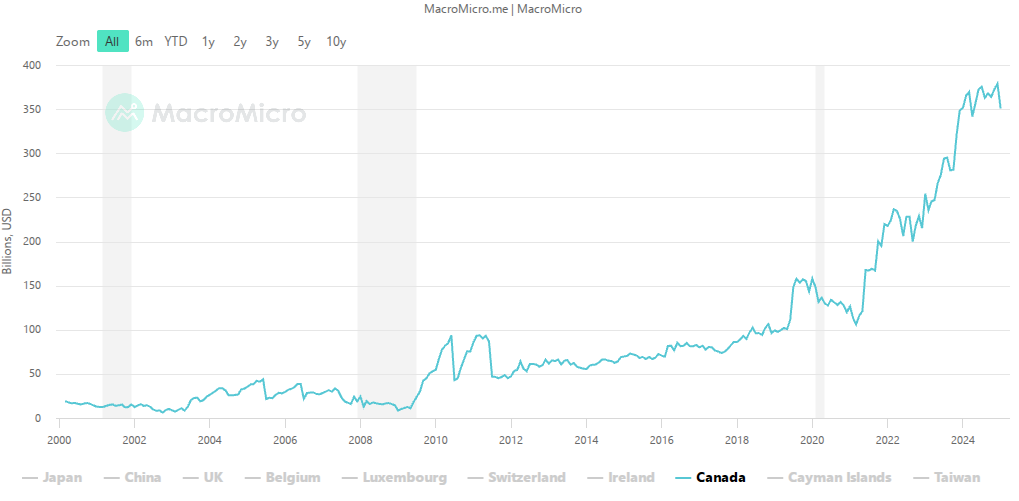
- Canada bucked the trend, increasing its holdings by $11 billion
Top Foreign Holders (as of Q4):
- Six Financial Hubs: $2.56 trillion
- Eurozone (incl. Luxembourg, Belgium, Ireland): $1.79 trillion
- Japan: $1.06 trillion
- China & Hong Kong: $1.01 trillion
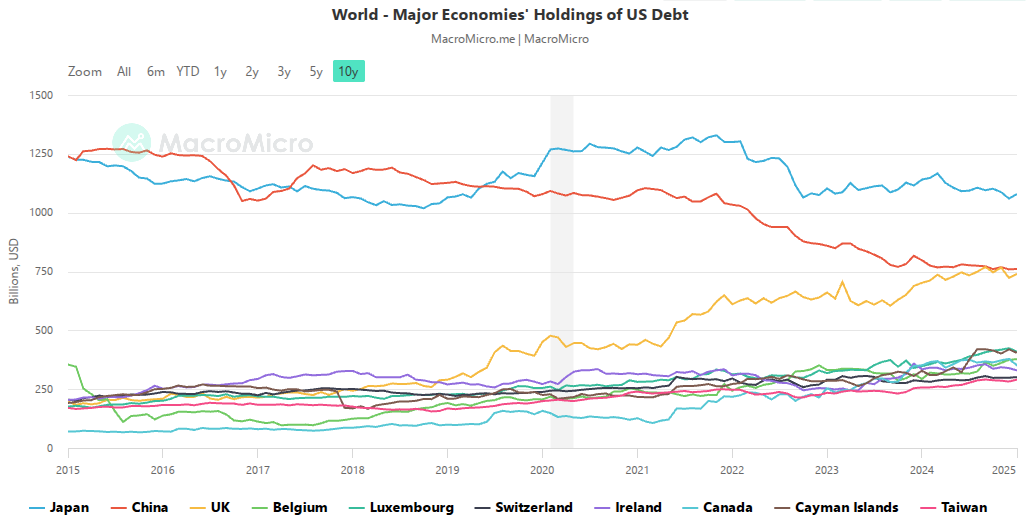
Notable Trends:
- Many holdings via financial hubs reflect U.S. corporate offshore cash management strategies—e.g., Apple previously held large U.S. bond positions in Ireland.
- The Eurozone has overtaken China as a major U.S. debt holder, while China and Hong Kong have consistently reduced exposure over the past decade.
- Canada's holdings have tripled since the pandemic, reaching $379 billion.
- Other key holders include Taiwan ($282B), India ($219B), and Brazil ($202B).
Domestic Holders – $20.33 Trillion (69.8% of Public Debt)
U.S.-based investors hold the majority of publicly traded Treasury securities. Here’s the breakdown and Q4 activity:
- Mutual Funds: $5.5 trillion (19.3%)
- Includes both bond and money market funds
- Money Market Funds alone held $3.0 trillion, with $2.4 trillion in T-Bills
- Q4 net purchases: +$335 billion
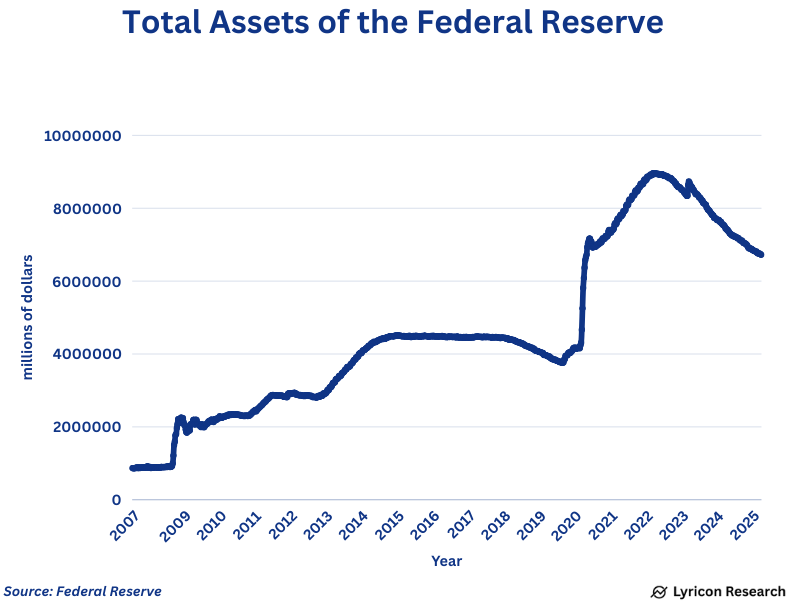
- Federal Reserve: $4.29 trillion (15.2%)
- Continued to unwind balance sheet via Quantitative Tightening (QT)
- Q4 net reduction: -$93 billion
- Since mid-2022, the Fed has offloaded $1.53 trillion in Treasuries, total assets down $2.2 trillion
- Households and Nonprofits: $2.68 trillion (9.5%)
- Q4 net reduction: -$229 billion
- Commercial Banks: $1.77 trillion (6.2%)
- Includes U.S. chartered banks, foreign bank branches, and credit unions
- Q4 net purchases: +$33 billion
- State & Local Governments (incl. pensions): $2.07 trillion (7.3%)
- Q4 net reduction: -$28 billion
- Insurance Companies: $650 billion (2.3%)
- Property & Casualty Insurers: $459 billion (doubled since Q4 2022; +$40B in Q4)
- Life Insurers: $191 billion
- ETFs: $554 billion (2.0%)
- Private Pension Funds: $452 billion (1.6%)
- Q4 net reduction: -$13 billion
- Broker-Dealers: $408 billion (1.4%)
- Q4 net increase: +$72 billion
- Government-Sponsored Enterprises (e.g., Fannie Mae, Freddie Mac): $227 billion (0.8%)
- Q4 net increase: +$36 billion
- Other Domestic Investors: $417 billion
- U.S. non-financial corporations (ex-foreign holdings): $114 billion
- Non-corporate businesses: $87 billion
- Holding companies: $130 billion
- Central clearing counterparties: $86 billion
- Non-marketable Securities (Series I & EE Bonds): $575 billion (2.1%)
Conclusion and Investment Implications
The composition of U.S. Treasury holders shifted meaningfully in Q4. Foreign entities, especially traditional buyers like Japan and major offshore financial centers, collectively reduced holdings by $166 billion. In contrast, Canada and U.S. institutions such as money market funds and banks increased exposure.
Meanwhile, households and pension funds trimmed positions. The Fed continued its QT program, selling $93 billion in Treasuries, further tightening liquidity conditions.
Each liability is someone else’s asset. While individuals or companies can discharge debt through bankruptcy, governments cannot. The only path to reducing sovereign debt burdens is robust inflation and sustained economic growth.
Inflation is easy to generate; growth, especially in mature economies, is not. Excessive inflation, if left unchecked, can destabilize markets—and currencies. If debt is not managed responsibly, the end result will likely be persistently elevated inflation. We are only beginning to repay past excesses. And governments rarely lose.
The credit risk of Treasuries (i.e., default risk) is virtually zero. But when investing in long-term securities (not just Treasuries), other risks emerge. First, inflation may rise and exceed your interest income, leading to insufficient real returns. Second, if market yields rise, bond prices may fall before maturity, potentially causing a loss if sold early. Even if held to maturity, the principal is returned in devalued dollars. If interest income cannot sufficiently offset inflation and other risks, it becomes a failed investment.
The bond market hates inflation.
"Fixed-coupon bonds provide no protection against runaway currency" - Warren Buffett
Disclaimer: This article is for informational purposes only and does not constitute investment advice. Investment decisions should be made based on individual financial circumstances, risk tolerance, and objectives. Always consult with a licensed financial advisor before making any investment decisions. Investing involves risk, including potential loss of principal.


